BPI Total ion flow diagram of burdock kernel under negative ion mode in five periods
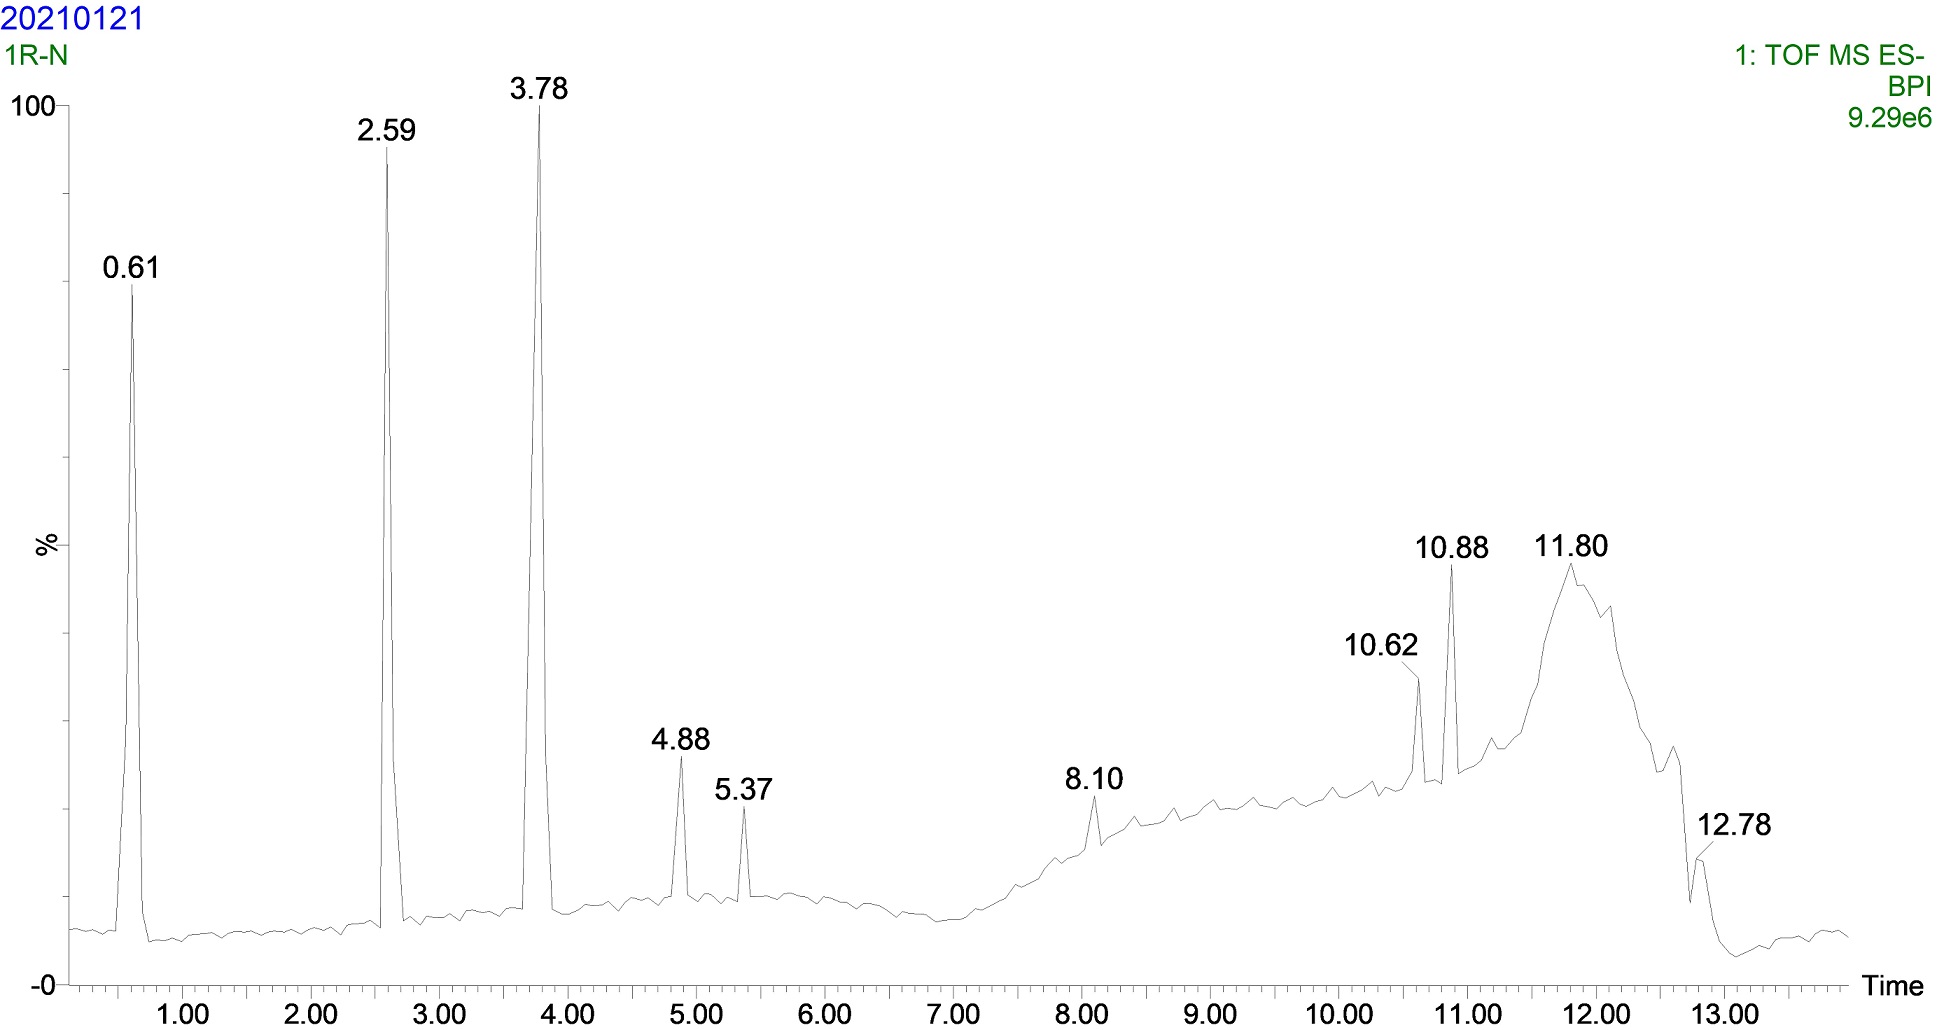
Figure 1 BPI total ion flow diagram of burdock kernel samples in the first period under negative ion mode
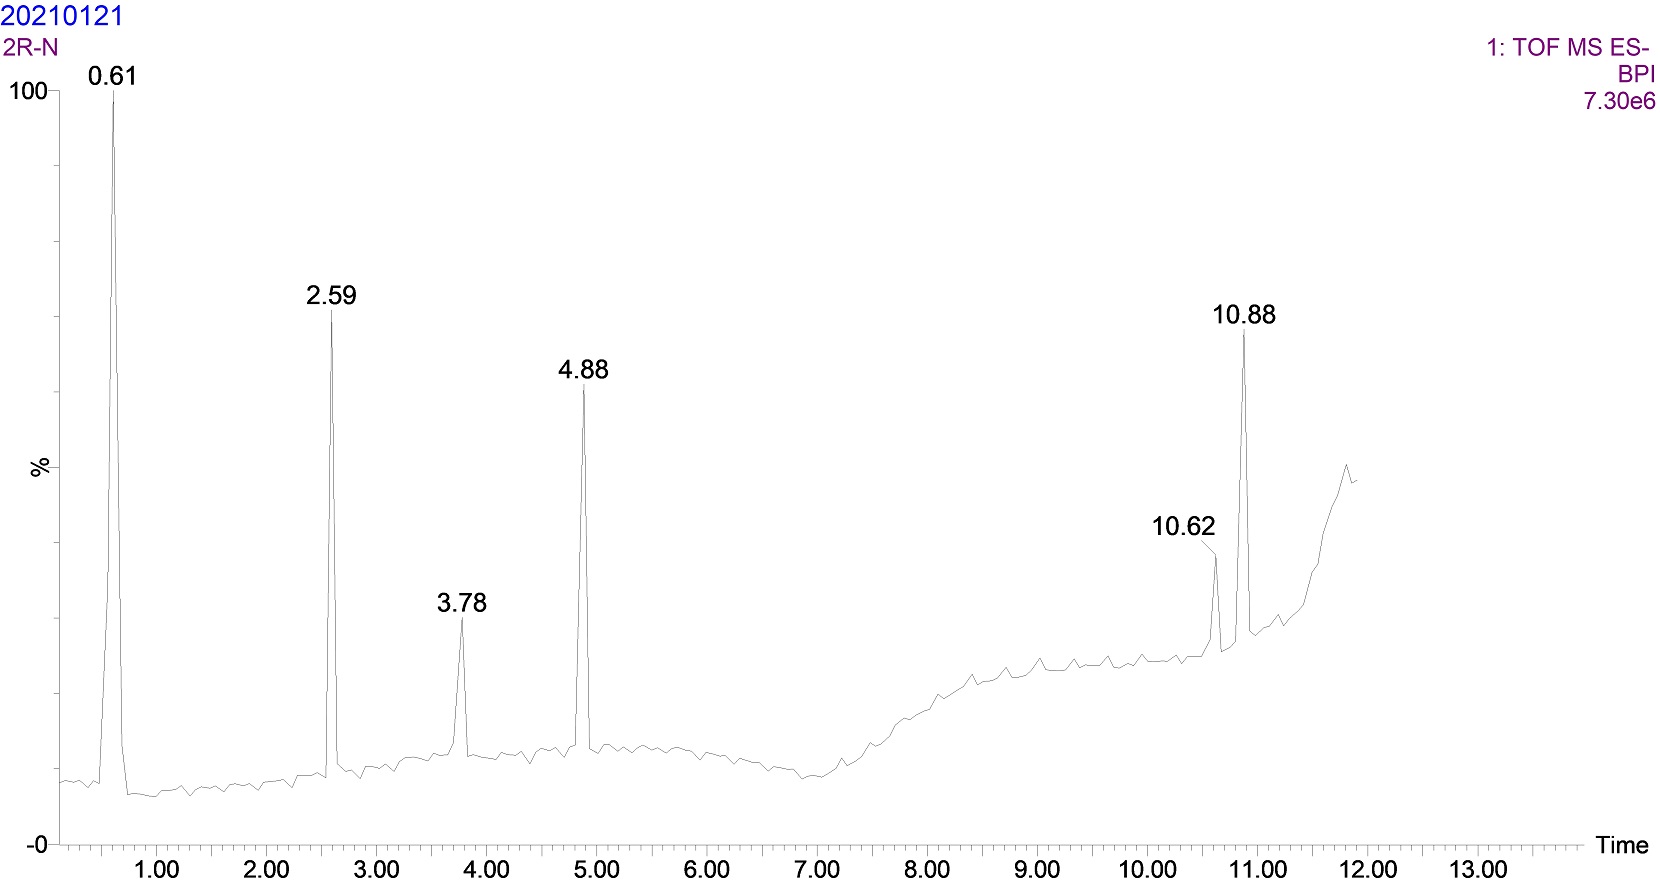
Figure 2 BPI total ion flow diagram of burdock kernel samples in the second period under negative ion mode
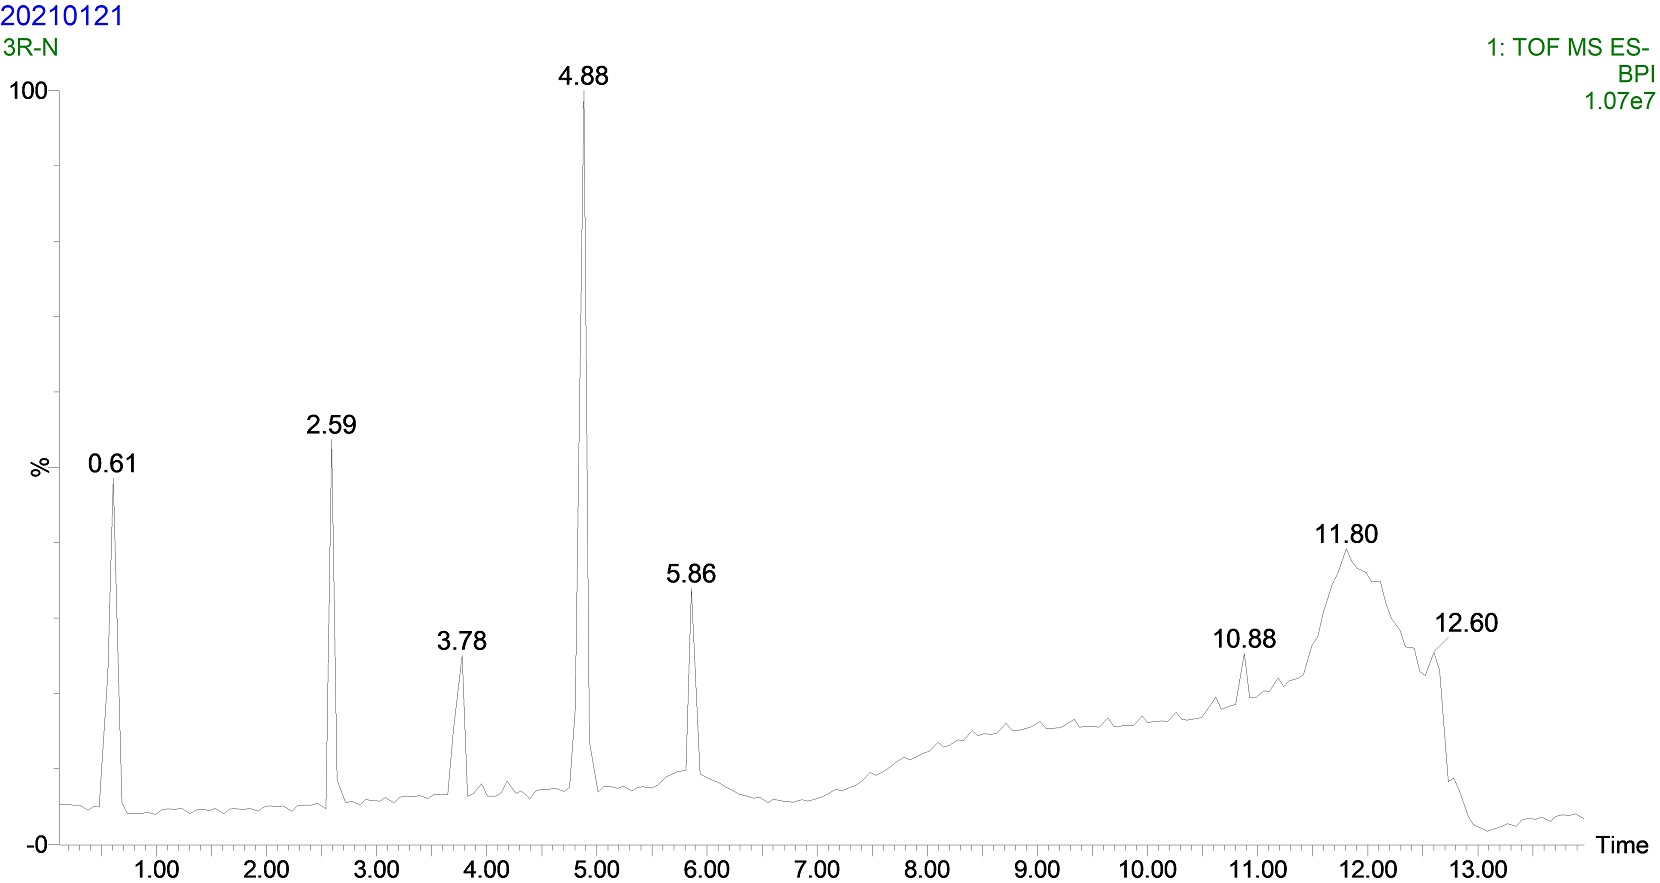
Figure 3 BPI total ion flow diagram of burdock kernel samples in the third period under negative ion mode
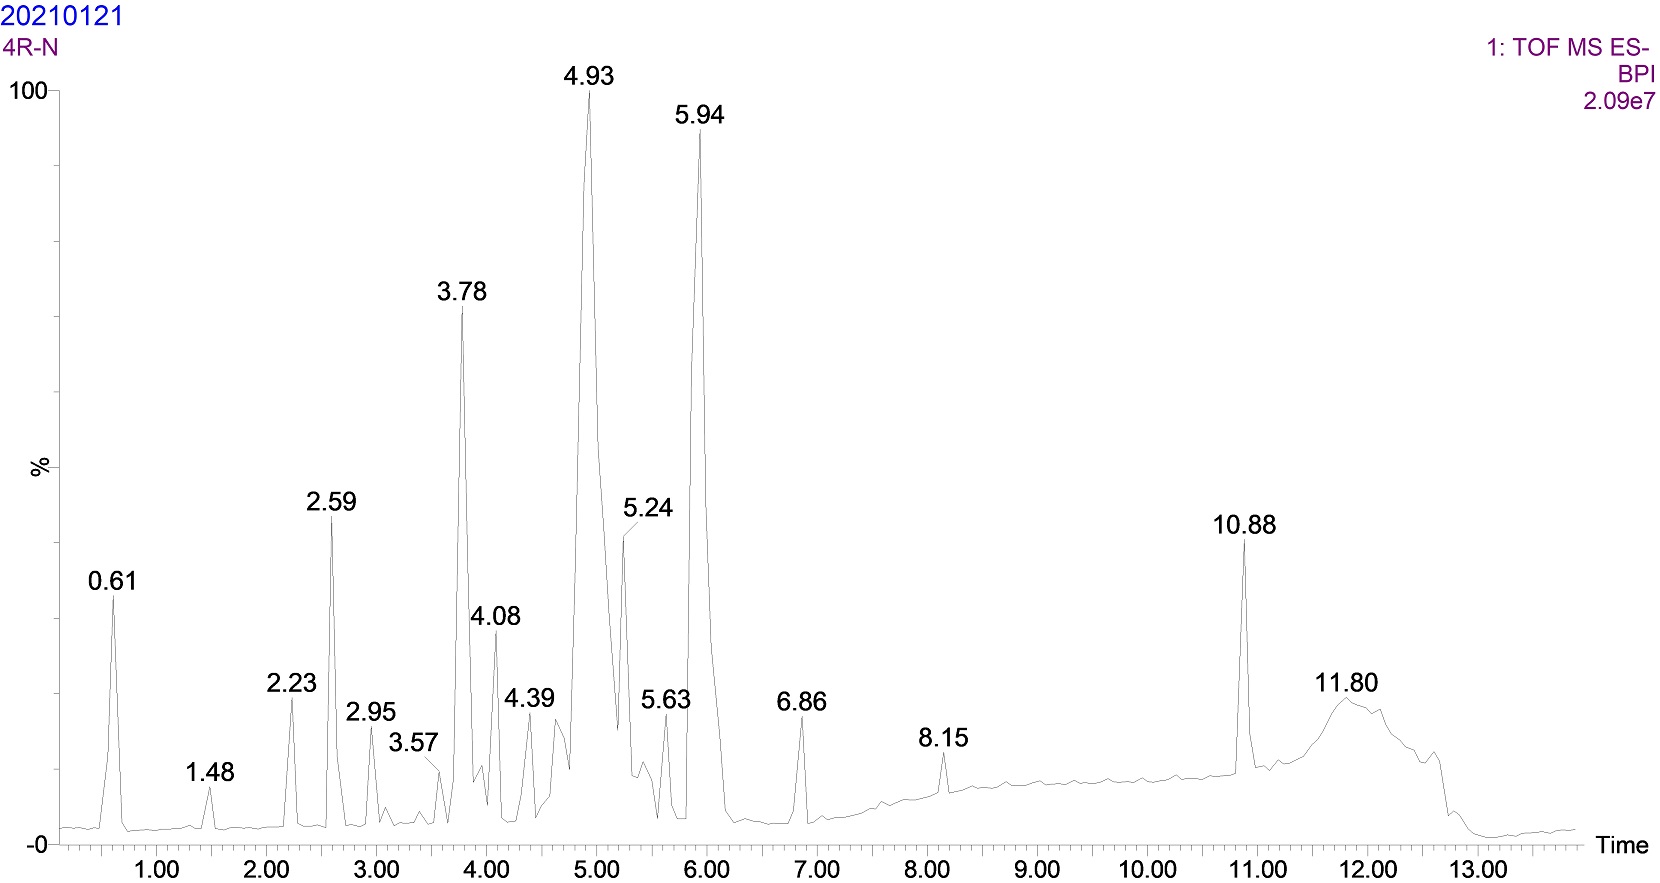
Figure 4 BPI total ion flow diagram of burdock kernel samples in the fourth period under negative ion mode
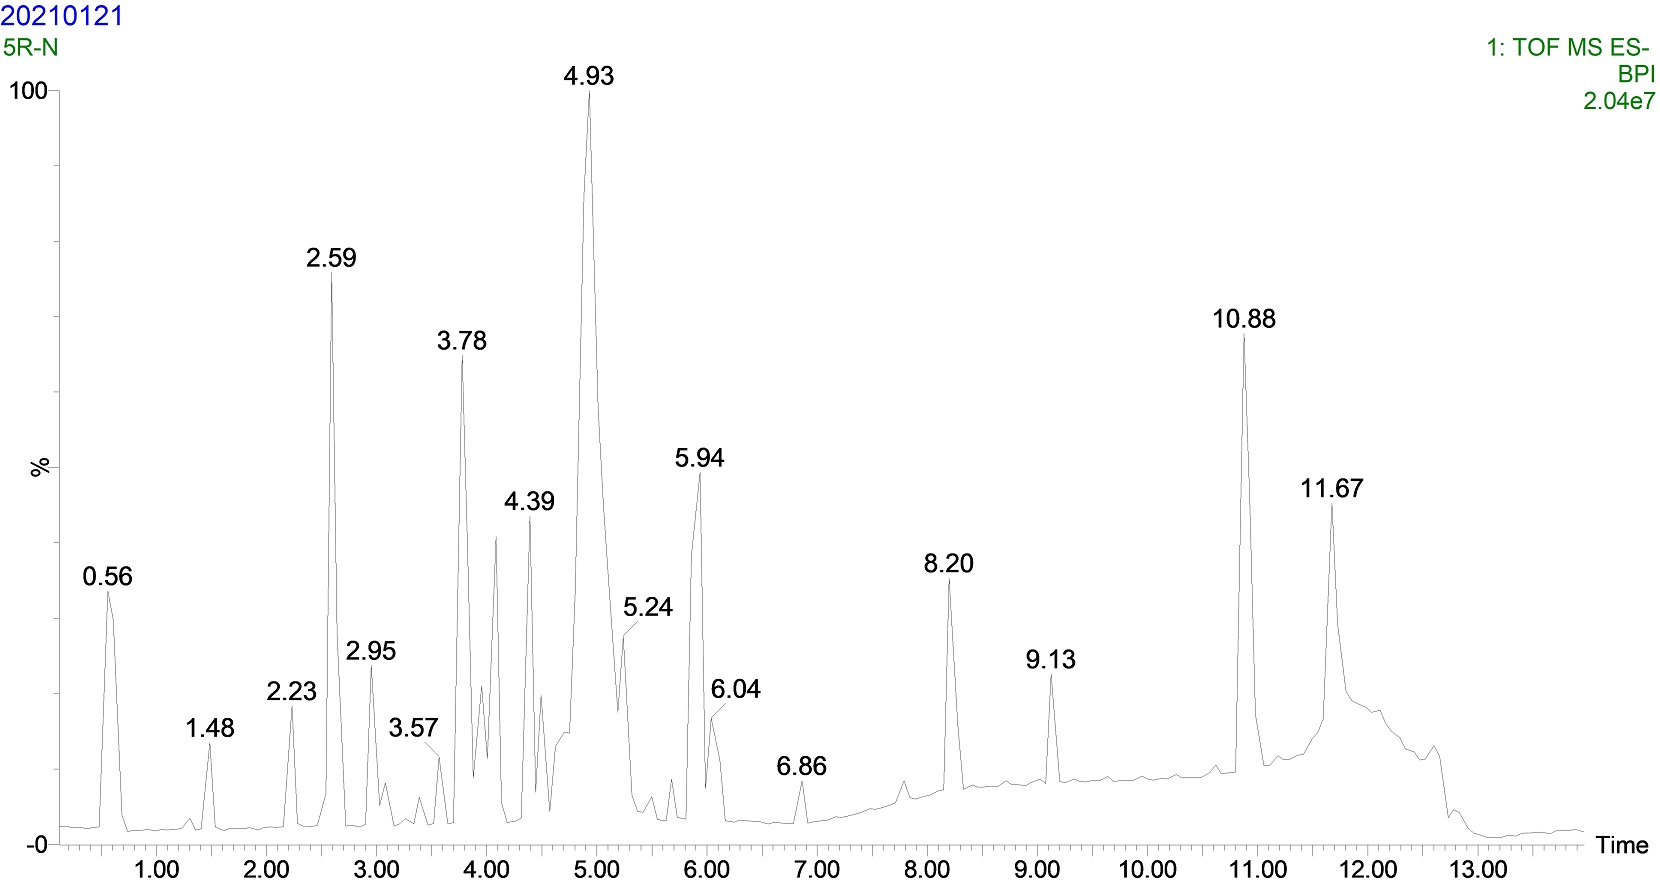
Figure 5 BPI total ion flow diagram of burdock kernel samples in the fifth period under negative ion mode
Selective Ion Response Intensity of Major Components in Burdock Kernels at Five Different Growth Stages
Note: "-" means that the response value of the selected ion's response strength is too low to accurately integrate the specific response value.
Identification Results of Burdock Kernels in Five Different Growth Periods under Ion Mode
Main Chemical Compositions
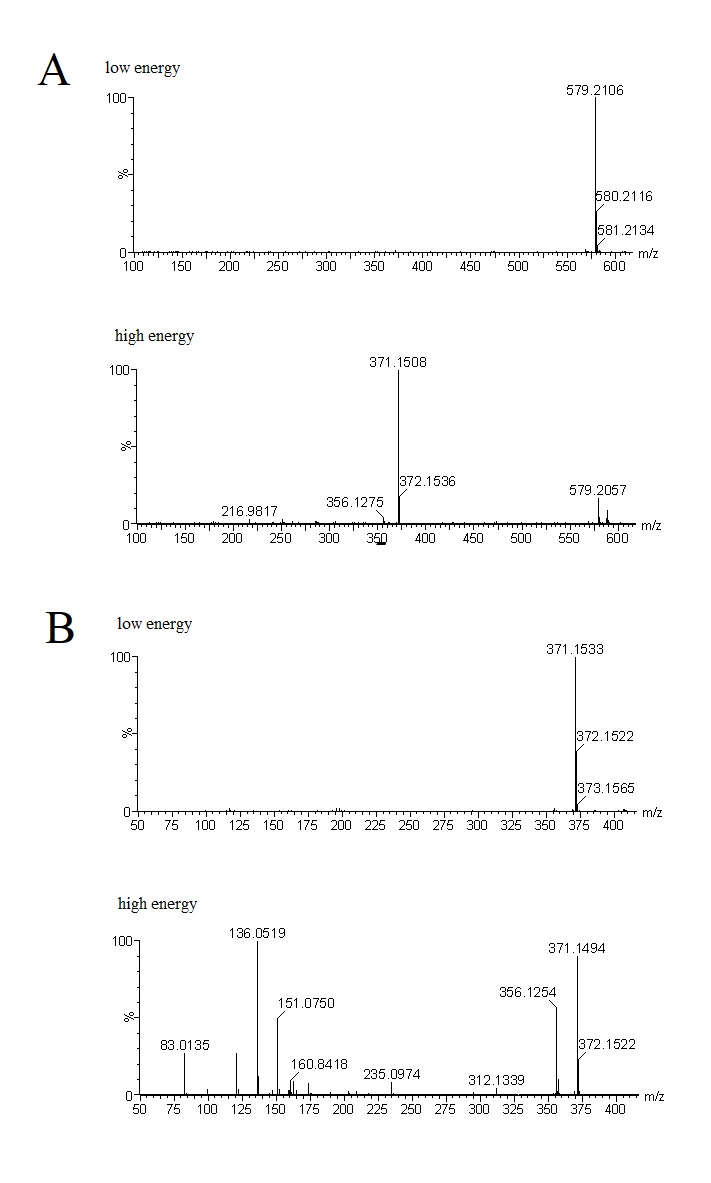
Figure Identification of compound arctiin and arctigenin in anion mode low energy/high energy channel mass spectrometry
A arctiin B arctigenin
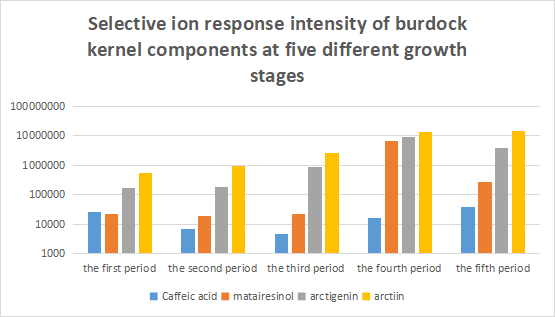
Figure Selective ion response intensity of burdock kernel components at five different growth stages